Data Cleaning in SQL
In this project we clean housing data in SQL Server.

I am a results-driven Data Analyst with expertise in Python, SQL, Excel, Tableau, PowerBi and Data Visualization. With a background in Mechanical Engineering and experience in Data Modeling and Analysis, I specialize in transforming complex datasets into actionable insights. Passionate about problem-solving, I aim to support Data-Driven Decision-Making in dynamic environments. @manav-singh-130579289
In this project we clean housing data in SQL Server.

Data Exploration of Covid 19 Dataset in SQL Server.

This holds all of my Tablau Dashboards.
This holds the web scraping of Amazon Website using Python.
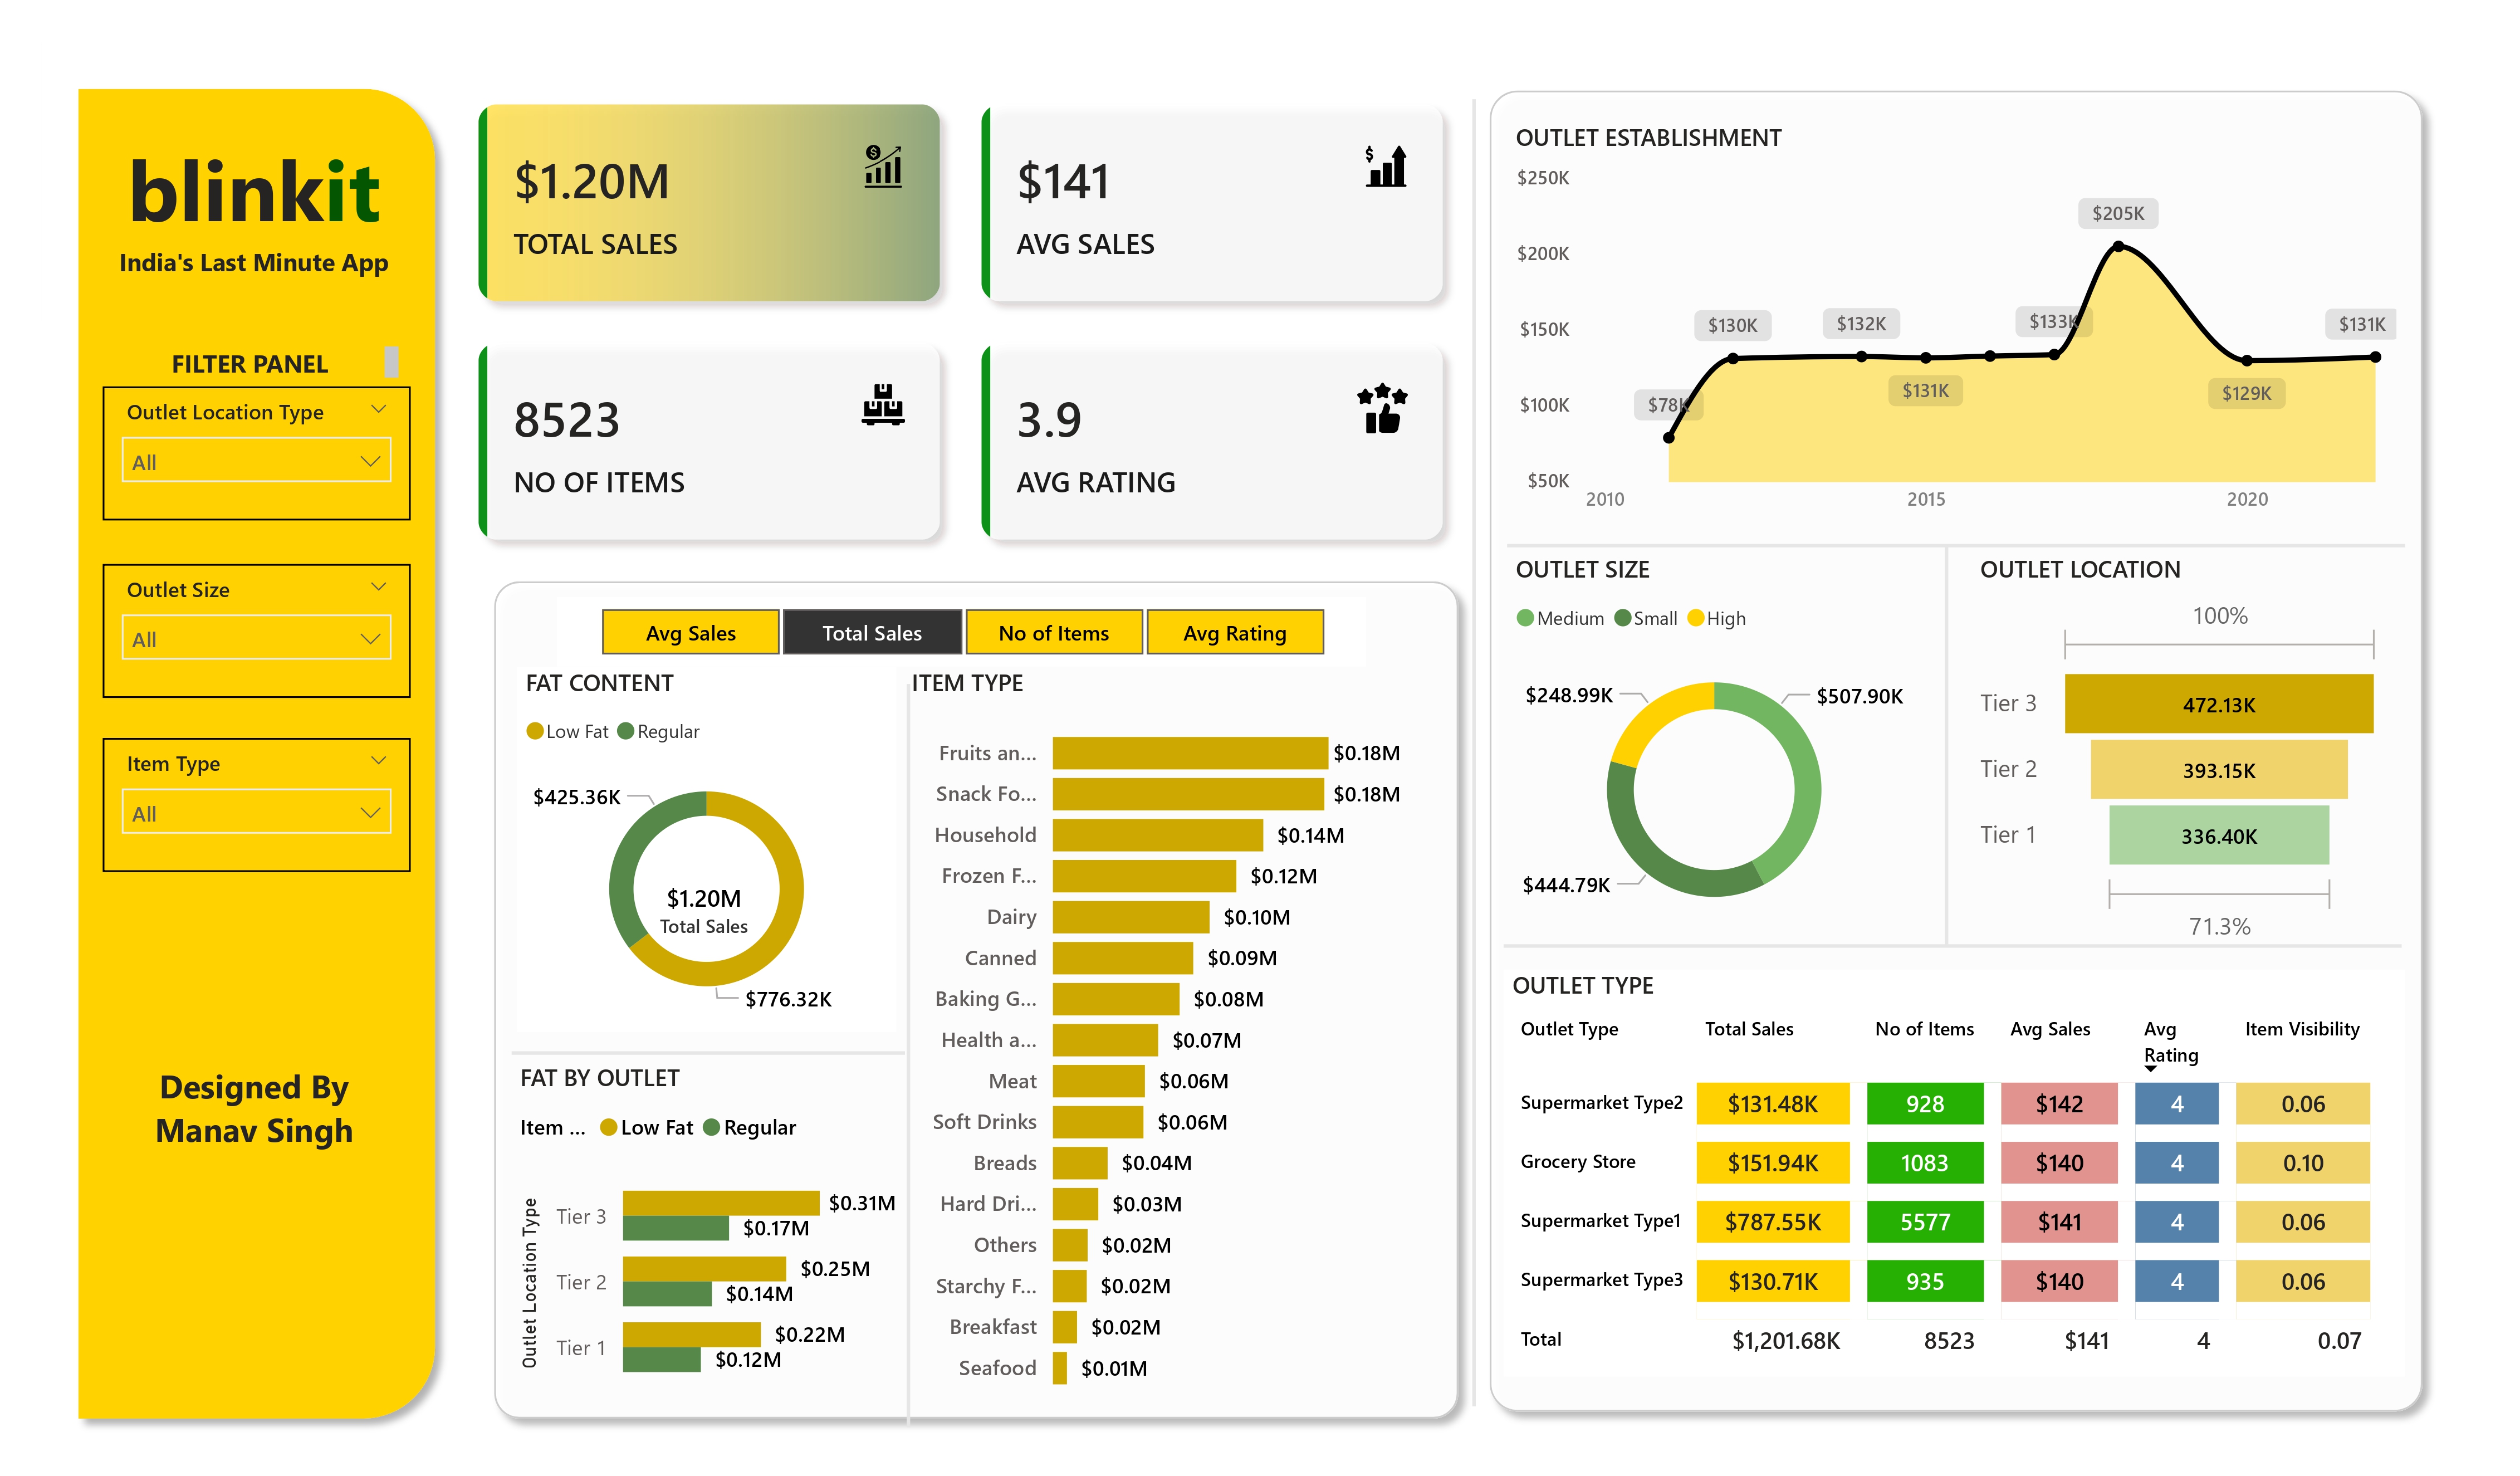
This holds the PowerBi BlinkIt Sales Dashboard.
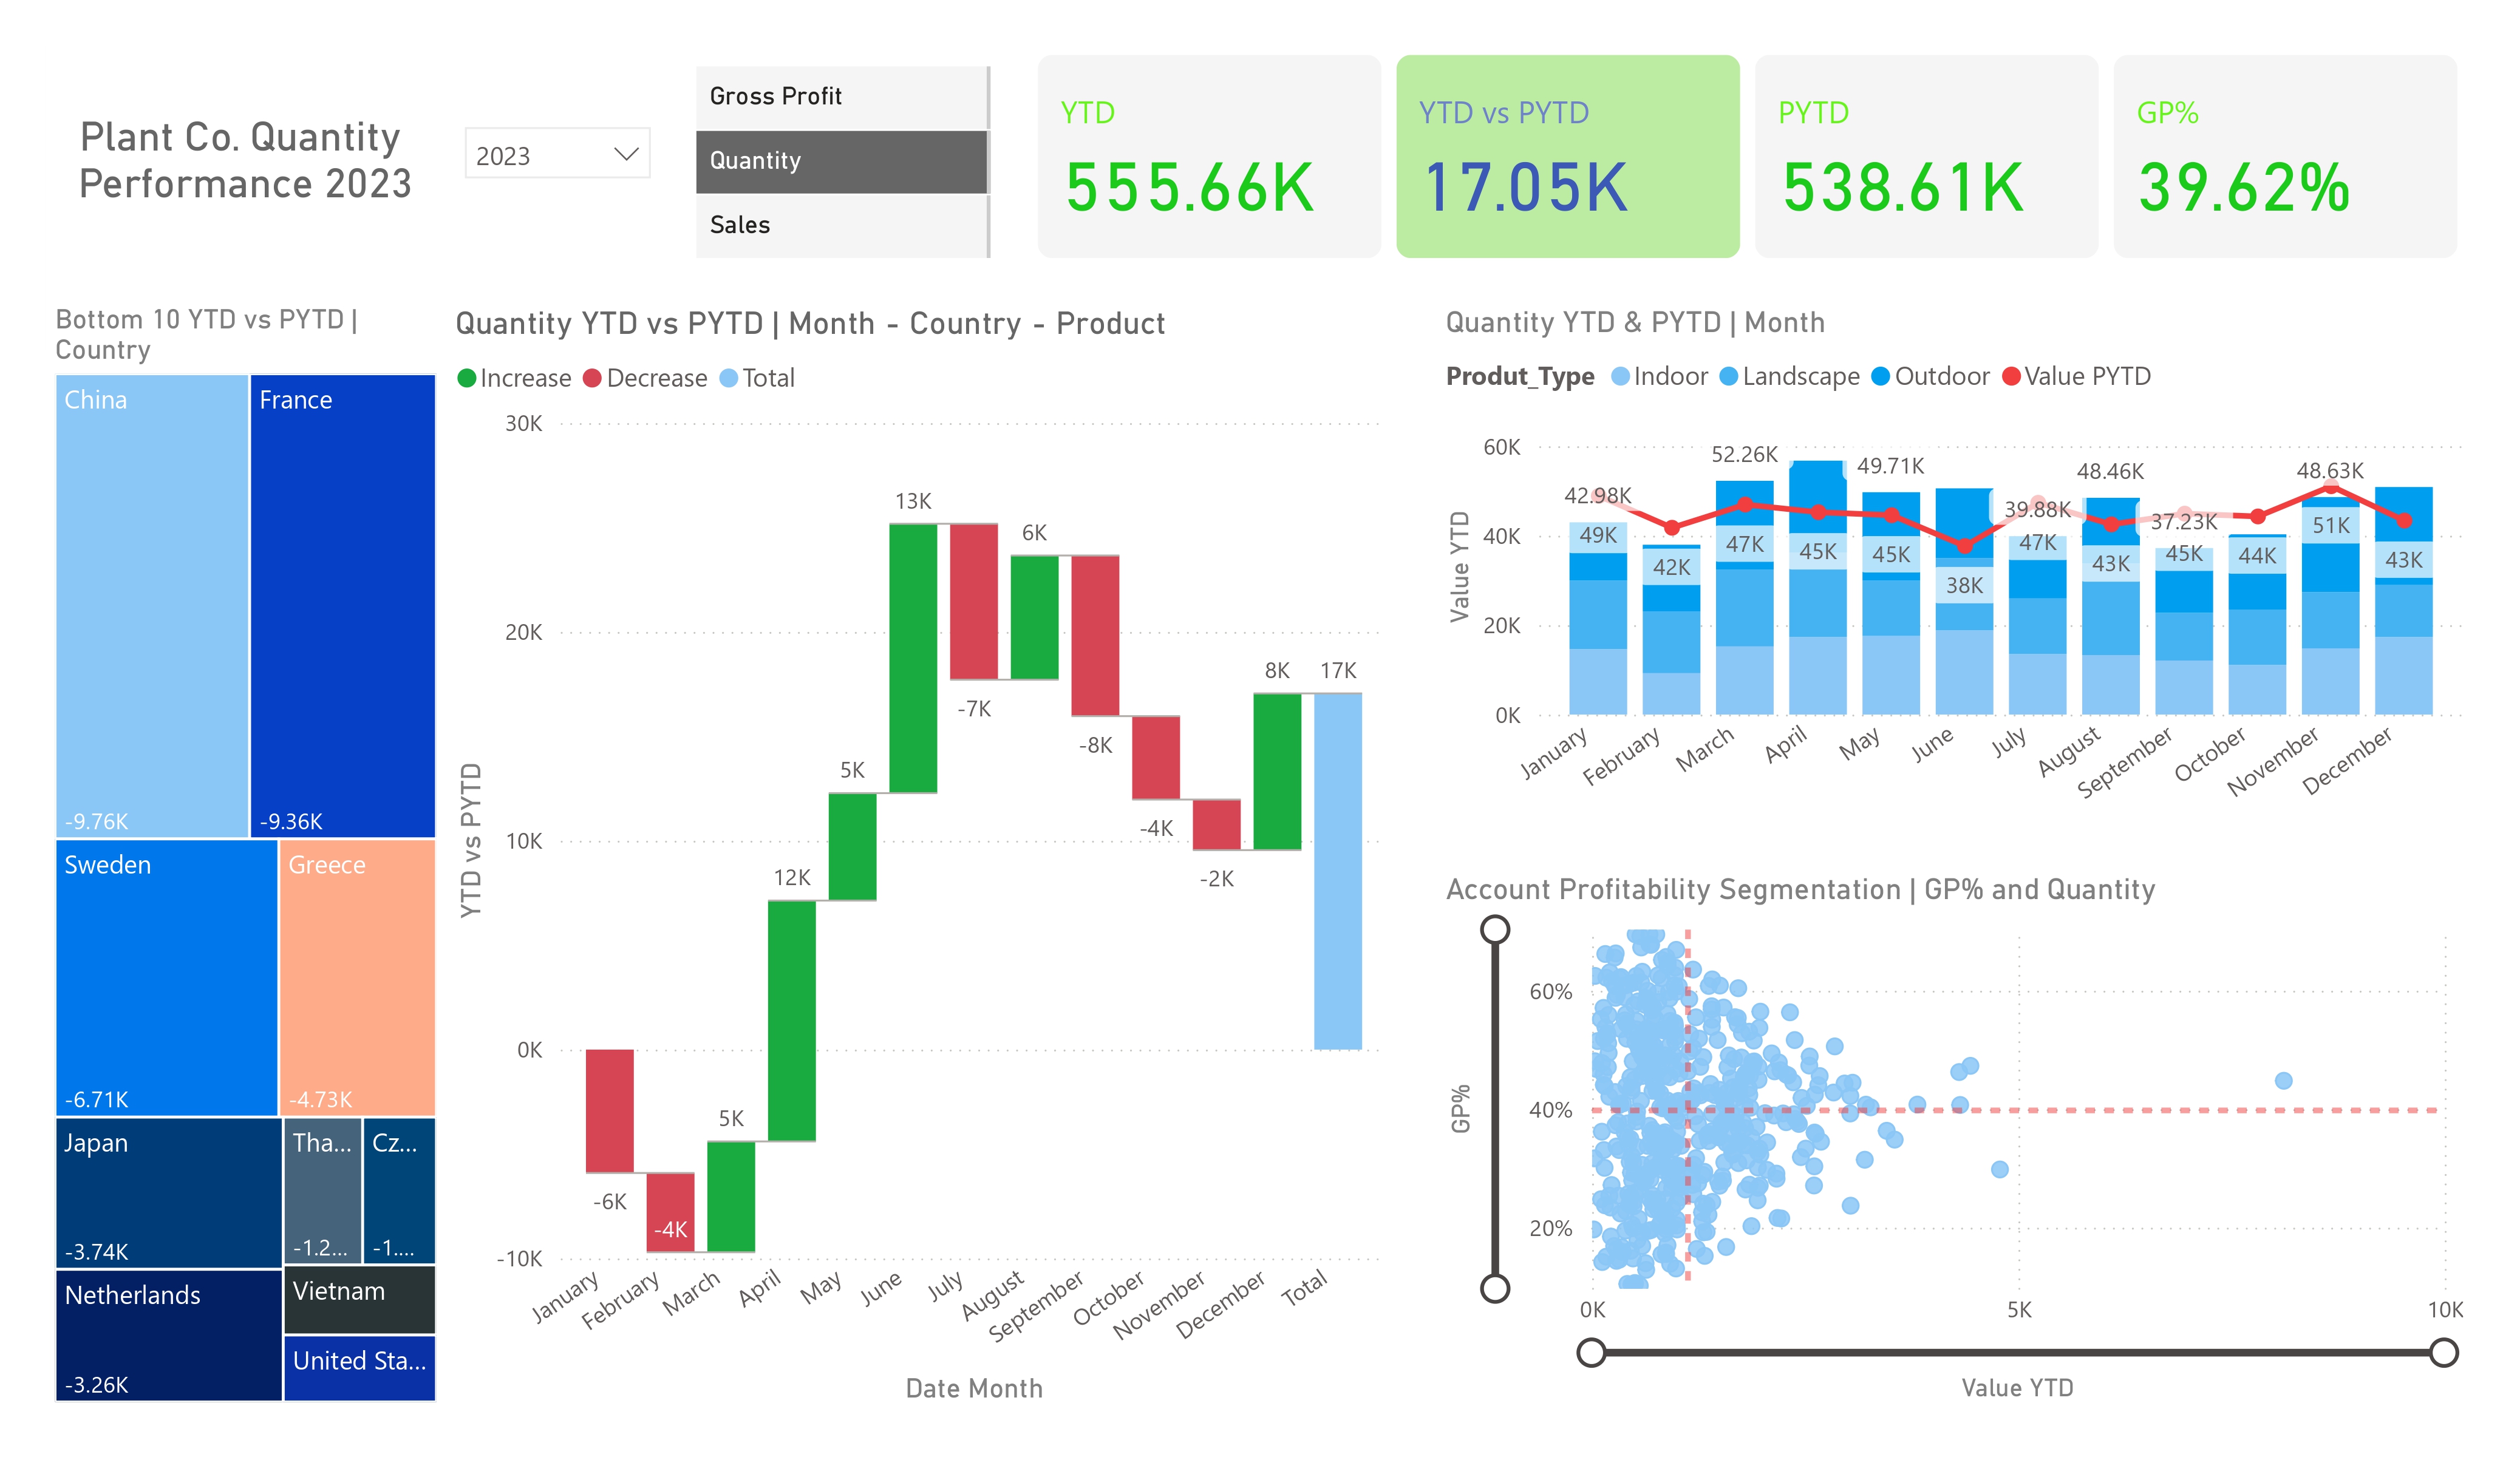
This holds the Performance Report Dashboard.
Designed an interactive dashboard using Switch Measures and Conditional Formatting to analyze YTD vs PYTD Sales, Quantity, and Gross Profit %. The report highlights key business pain points and growth opportunities with clear visual storytelling.
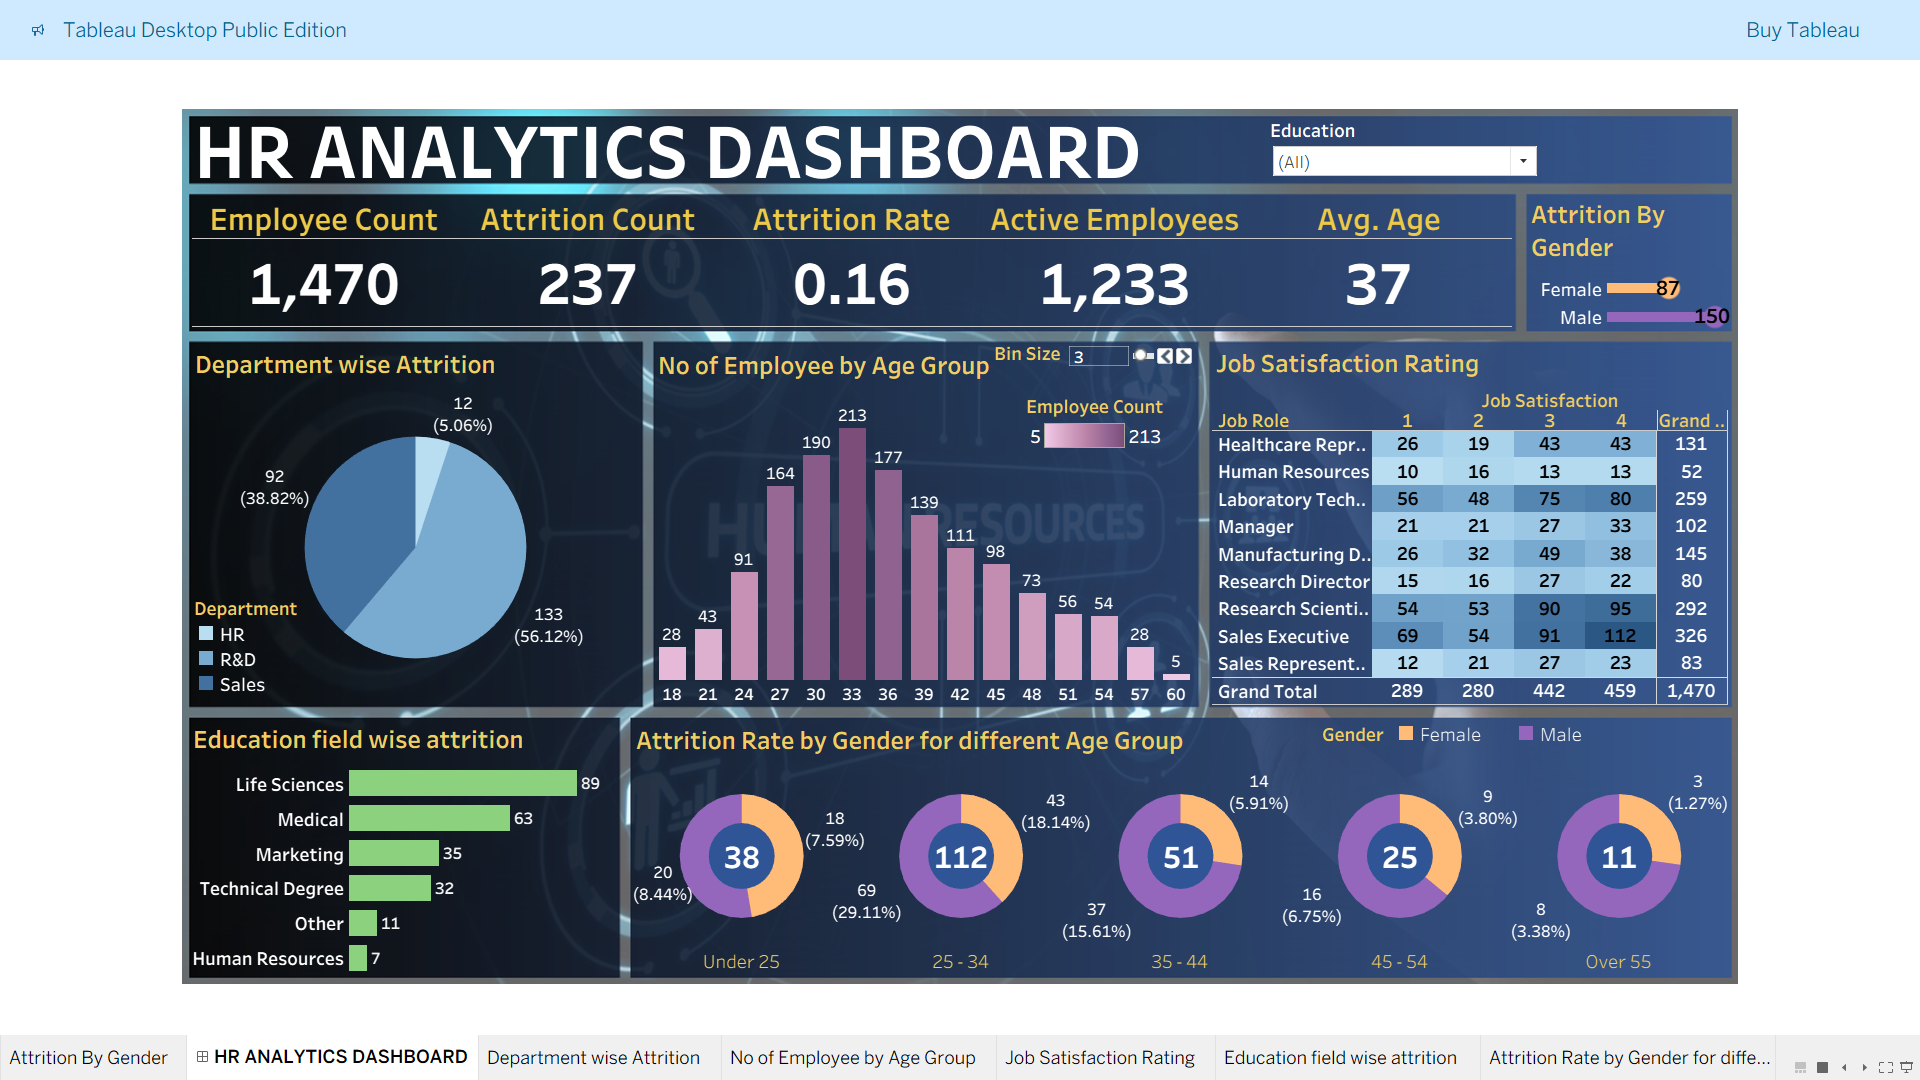
This holds the Hr Analytics Tableau Dashboard.
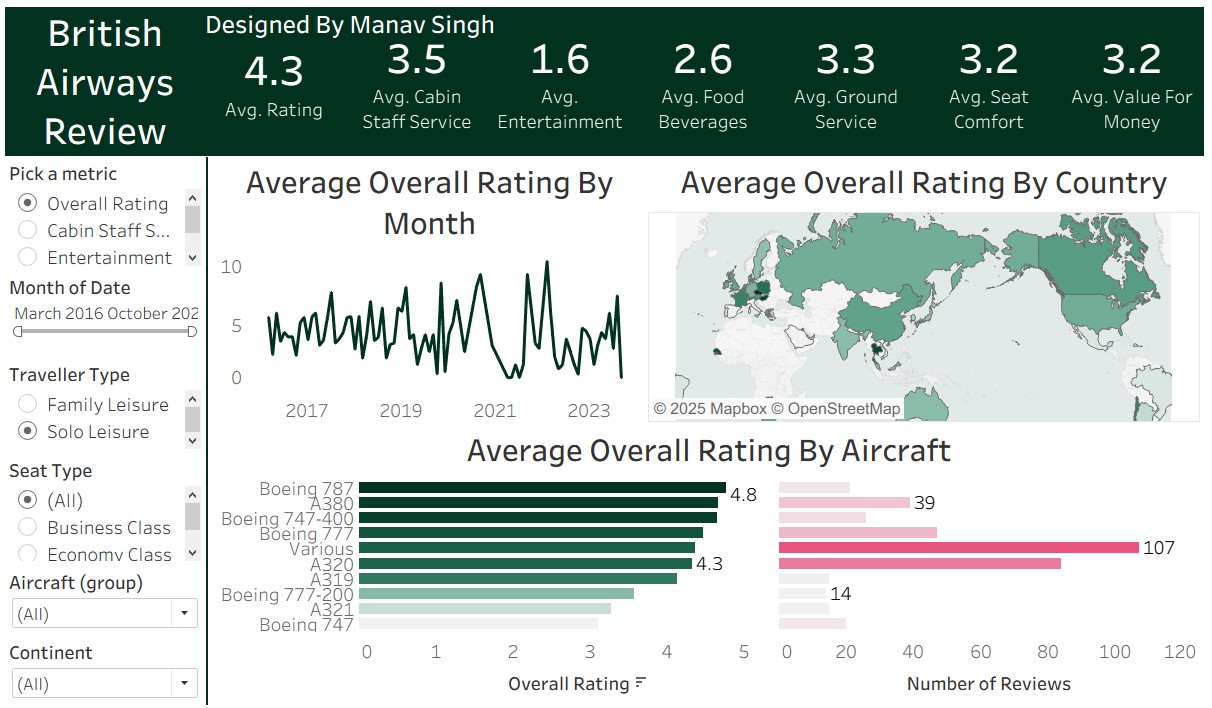
This interactive dashboard analyzes customer reviews & ratings to uncover insights such as:
⭐ Service quality evaluation
📊 Customer satisfaction across different parameters
🌍 Review trends by region & category
🔎 Identifying key improvement areas.
This holds the London Bike Rides Tableau Dashboard.
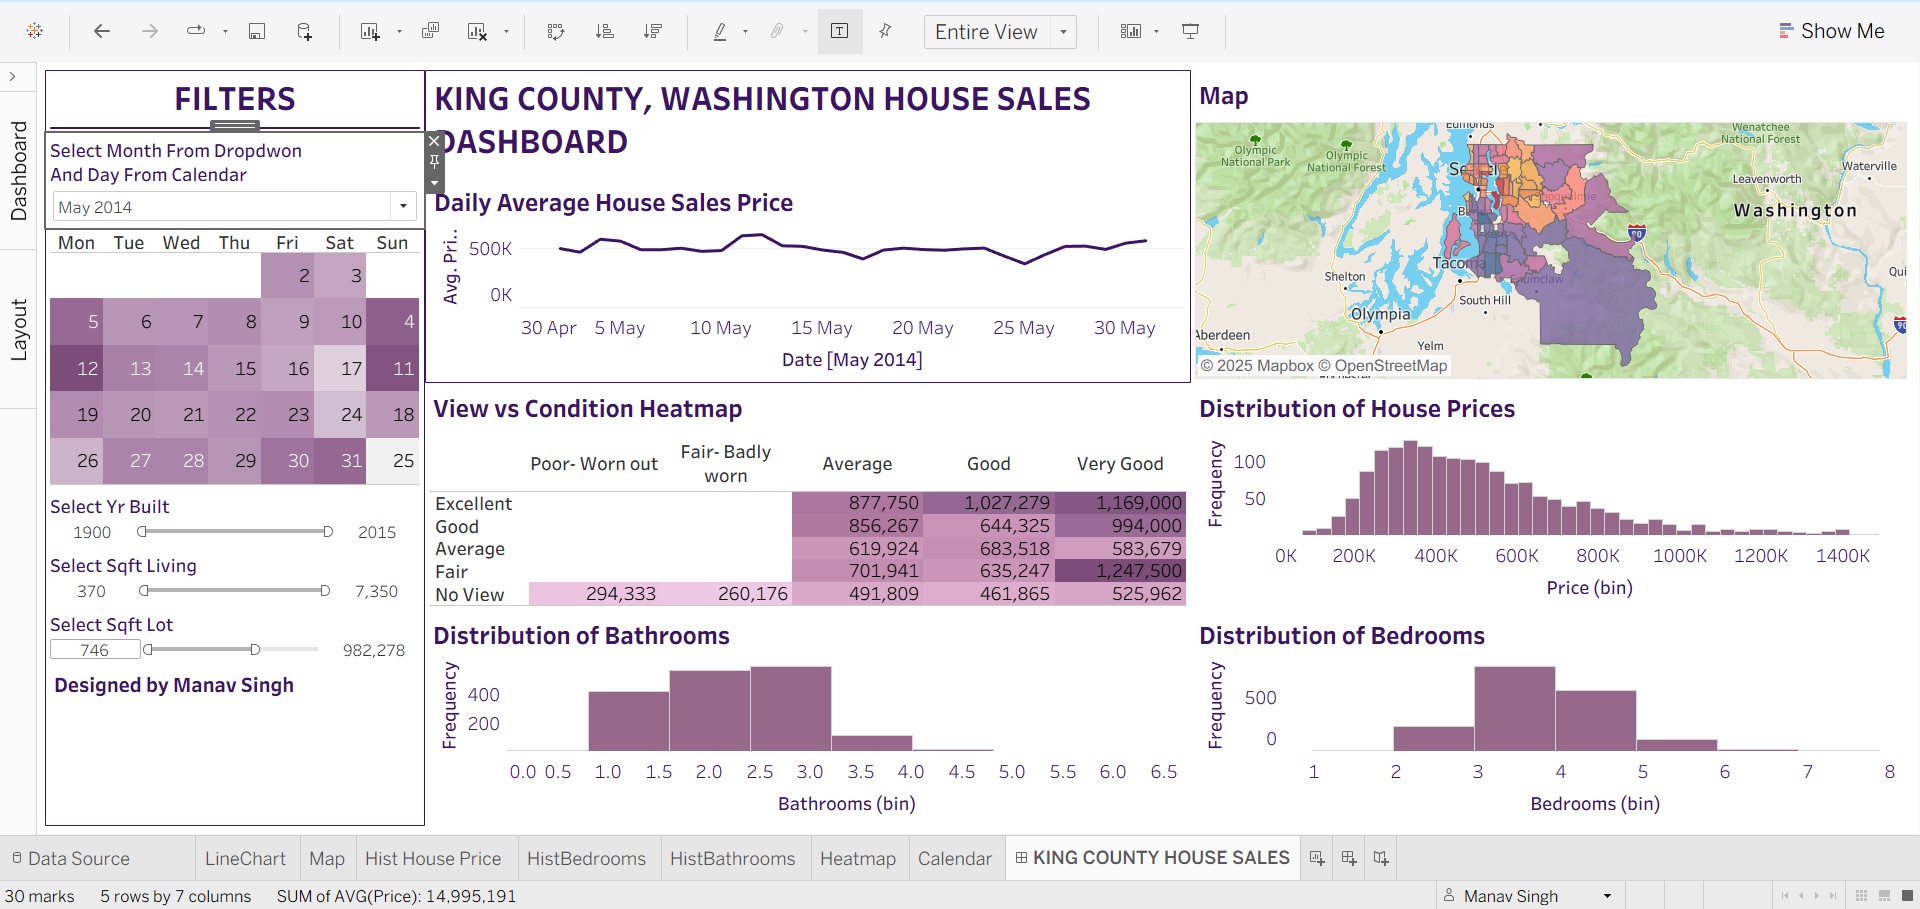
This holds the King County House Sales Tableau Dashboard.
This holds the Impact of social media on academic performance dashboard (Powerbi)
Impact Analysis Dashboard (Power BI)
An elegant dashboard designed in Power BI using Excel-exported datasets. This project highlights key metrics, trends, and insights in a visually engaging way. By integrating data modeling, DAX calculations, and interactive visuals, the dashboard simplifies complex data into actionable business intelligence. 🔧 Tech Stack: Power BI, Excel, DAX, Power Query 📊 Focus: Impact tracking, KPIs, and decision-support
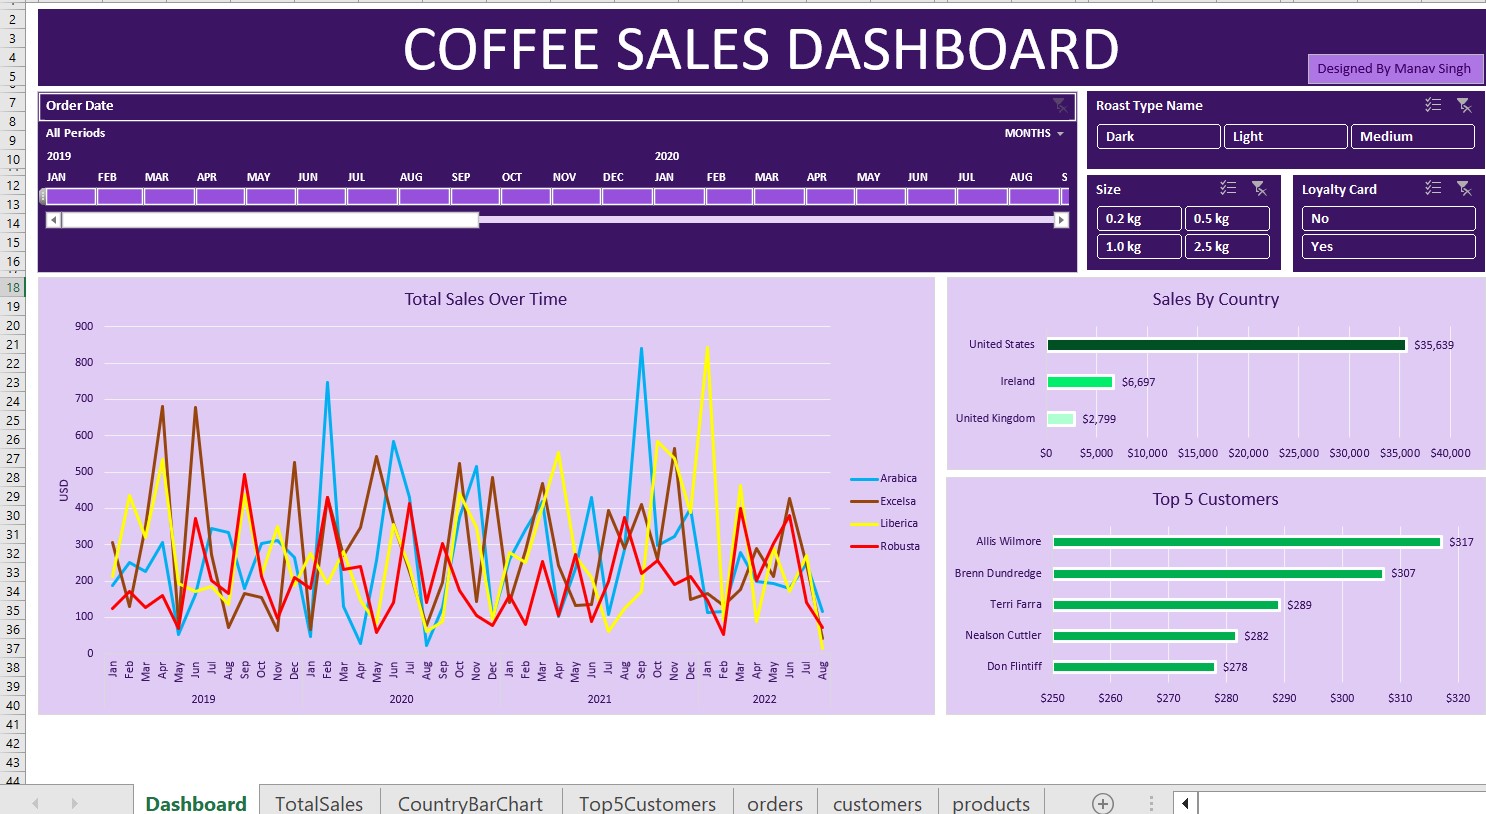
This holds the Cofee Sales Excel Project
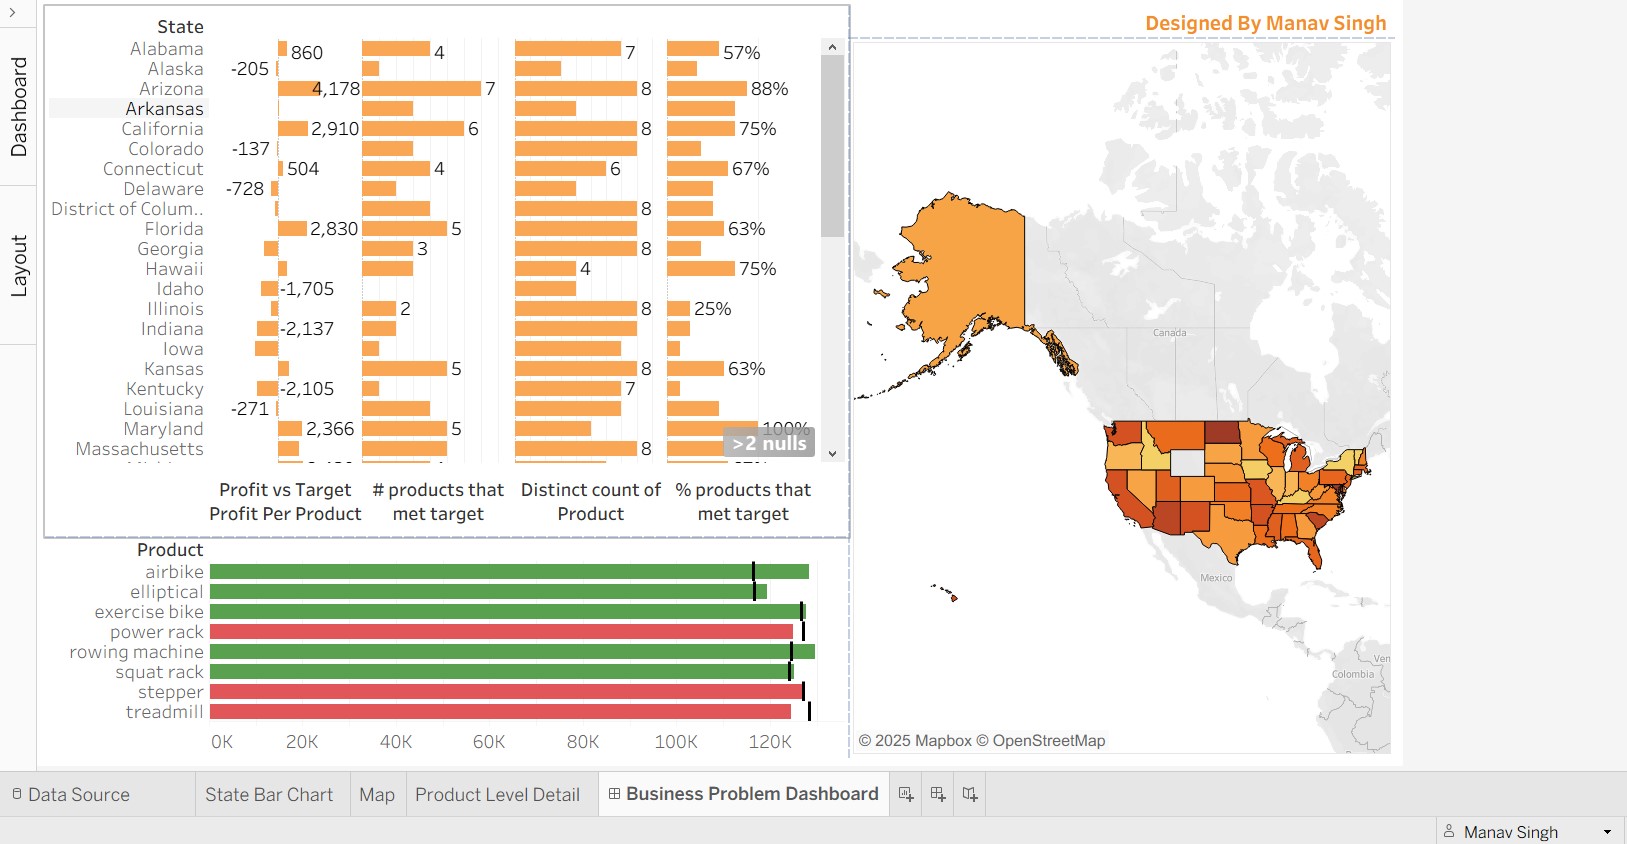
This holds my first Business Problem Project in Tableau
📊 Business Problem Dashboard An interactive Tableau dashboard designed to compare actual vs. target performance across key business metrics. The project highlights performance gaps, supports KPI tracking, and delivers actionable insights for better decision-making.
GTB Nagar, Delhi-110009
+91-7838727621
manavalpha333@gmail.com